Your levels, on your own chart.
A TradingView Pine indicator that draws the same walls, gamma flip, vol trigger and max pain the terminal draws — on the chart you already trade from. It is included free on every plan, not sold as a per-platform add-on.
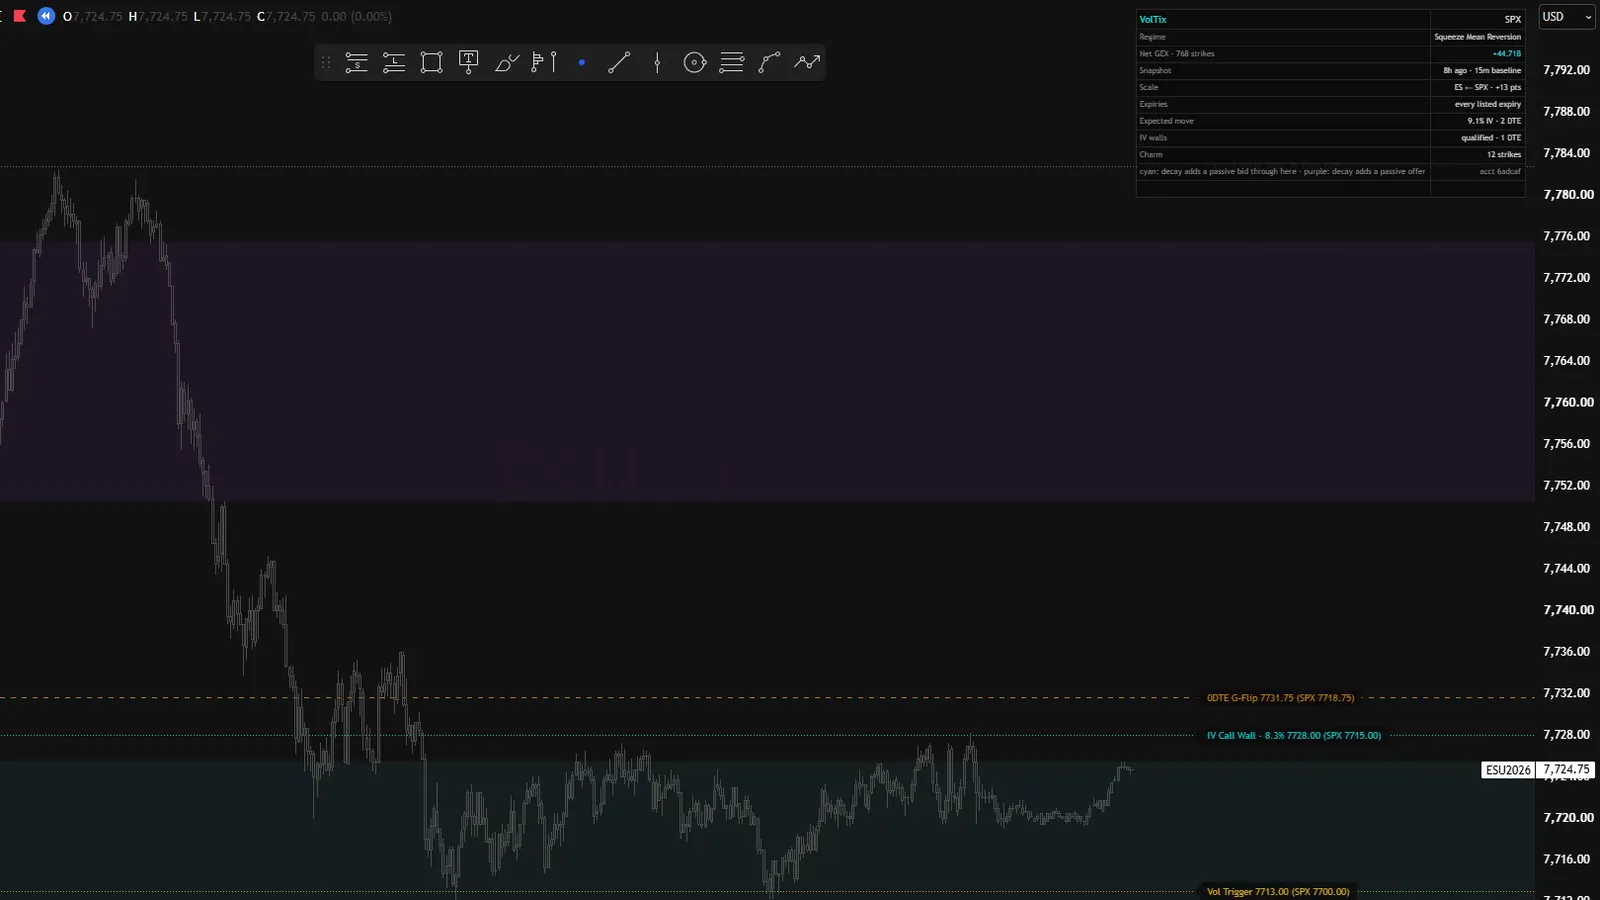
Seven levels, each one a toggle.
Every line has its own switch in the settings panel, so you can run the whole set or just the two you actually watch.
| Level | Line | Colour |
|---|---|---|
| Call Wall | solid | green |
| Call Wall 2 | dashed, dimmed | green |
| Gamma Flip | solid | amber |
| Put Wall | solid | red |
| Put Wall 2 | dashed, dimmed | red |
| Vol Trigger | dotted | amber |
| Max Pain | dotted | pale amber |
Style and behaviour
Label position — Left or Right of the last bar.
Line extend — Right, Both or None.
Show info table — The top-right panel, on or off.
Line width — 1 to 4.
Warn when older than — Hours before a pasted string is treated as stale. 24 by default.
Futures mode — Auto, Off or Manual ratio. Auto detects the contract; Manual pins the ratio yourself.
Walls are ranked by gamma exposure on their own side of spot — calls above, puts below — so the second wall is the next-strongest on that side rather than the next strike along. A call wall underneath price is open interest the tape has already traded through, not a level anything is defending, so it isn't drawn as one.
The info table sits top-right with the regime, net GEX, how old your pasted data is, and which scale is being applied.
Put it on ES1!, NQ1!, RTY1!or their micros and the SPX, NDX and RUT levels convert automatically to the contract's price, so a level you read in the terminal lands where you actually trade it.
Three steps, once.
Open the Indicators tab
In the terminal, under Account → Indicators, download voltix-levels.pine and paste it into TradingView's Pine Editor: Open → New indicator → paste → Save → Add to chart.
Copy the payload
On the dashboard, click Copy Pine data. It puts the current levels on your clipboard as one compact string.
Paste it into the indicator's inputs
Indicator settings (⚙) → Data string → paste → OK. The lines draw immediately.
Why you have to paste anything at all.
Pine Script has no network primitive. It cannot make an authenticated HTTP request, and it cannot make an unauthenticated one either. That is a TradingView platform limit with no workaround, and every GEX indicator on the platform hits it.
So the levels arrive as a string you copy from the dashboard. One paste, and the script decodes the whole set.
What the string carries
The ticker, spot, both walls on each side with their gamma exposure, the flip, the vol trigger, max pain, the regime, net GEX, and the time the snapshot was taken.
An empty field means absent, never zero — a thin chain can genuinely have no second wall on one side, and the indicator draws nothing there rather than inventing a strike.